
The latest articles published on ClimateCrisis.net.
Explore our reporting and explainers, then follow the topic guides for background. Publication dates help distinguish a current development from an older discussion.
Find the background behind a headline
Our articles cover climate evidence, energy and technology, and practical questions about a warming world. The list below is ordered by publication date. An explainer may use historical evidence to answer a recurring question; a newly published page is not necessarily reporting a new event.
Start with Energy & Technology for computing and electricity, or Cities & Climate for urban heat and local responses. For the wider context, use our climate evidence guide and overview of climate impacts.
How to read our coverage
Check whether a number is a measurement, an estimate or a scenario. Follow the source beside the claim for its original context. Image captions identify the place and date when available and distinguish historical illustrations from current events.
For a correction, send the article URL and the specific claim through our contact page. Our editorial information explains the site’s scope and use of AI assistance.

Electricity Emissions Factors Explained: Why One kWh Has More Than One Carbon Number
An electricity emissions factor depends on place, time, accounting method and system boundary. Learn which factor to use—and what it cannot prove.
Read article →
Food Loss and Food Waste Are Not the Same: How the Numbers Are Measured
A tonne of rice spilled during storage and a tray of cooked food discarded by a household are both food-system failures, but global statistics do not…
Read article →
Grid Losses Explained: Why Electricity Generated Is Not Electricity Delivered
Electricity generated is not the same as electricity delivered. Learn how grid losses are calculated, what they include and how to compare power systems fairly.
Read article →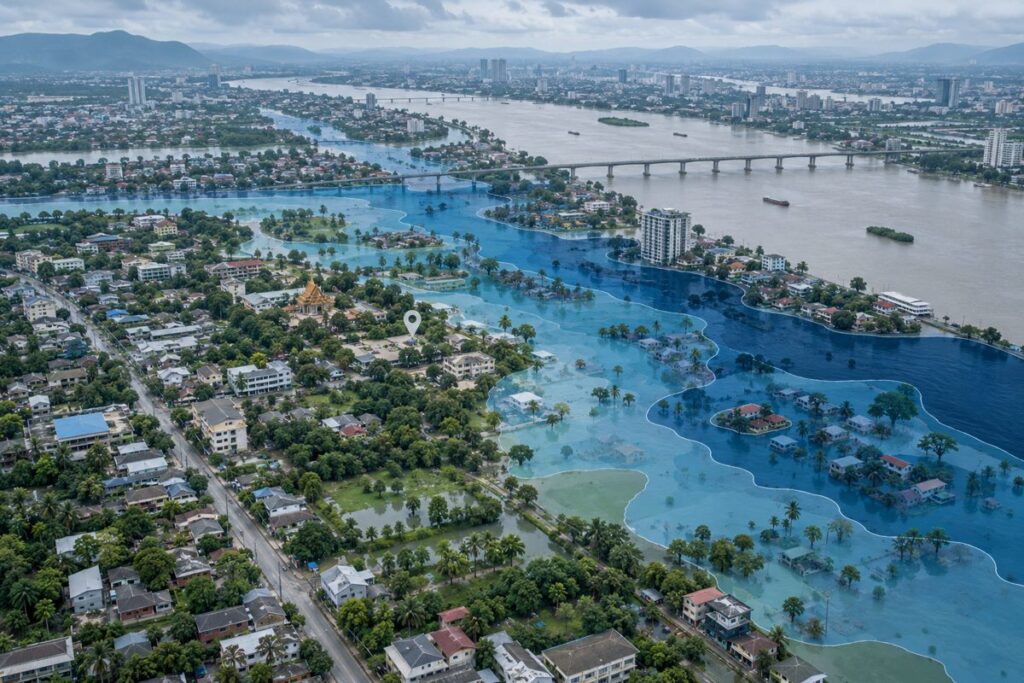
How to Read a Flood Map: Probability, Exposure and Residual Risk
A flood map is a model, not a forecast. Learn how probability, depth, exposure, vulnerability and residual risk change what its colours mean.
Read article →
Demand Flexibility in Thailand: What the IEA’s 2030 Scenario Actually Means
The IEA’s Thailand 2030 scenario explores lower electricity peaks. A worked example explains why shifting demand is different from saving energy.
Read article →
Drought Explained: Why Rainfall and Water Supply Tell Different Stories
Rainfall deficits, soil moisture and water supply measure different things. Learn to read drought reports, compare baselines and use Mekong monitoring in context.
Read article →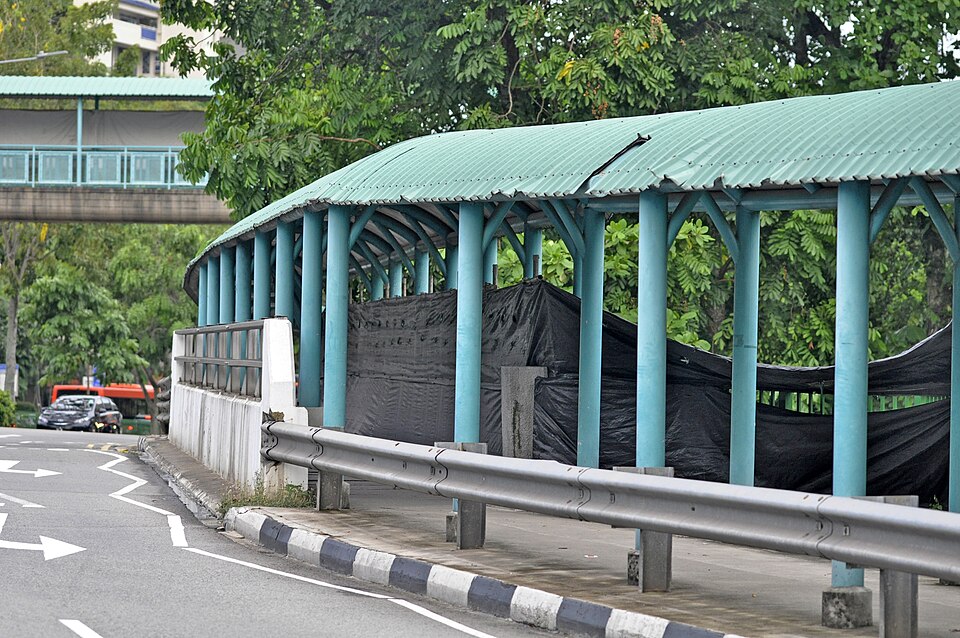
Heat Action Plans Explained: Who Acts After a Heat Warning?
A heat warning is only the start. Explore who acts, how delivery is measured, and what WHO guidance and Singapore’s workplace measures reveal about heat planning.
Read article →
Coral Bleaching Alerts Explained: Heat Stress, Reef Surveys and Recovery
Learn how coral bleaching alerts differ from reef surveys, what degree heating weeks measure, and why survey dates matter when judging damage or recovery.
Read article →
Why Renewable Projects Wait for Grid Connections: Reading the IEA’s 2026 Findings
A power plant announcement is not a grid connection. Explore the IEA’s 2026 findings, a solar export example and the questions to ask about local projects.
Read article →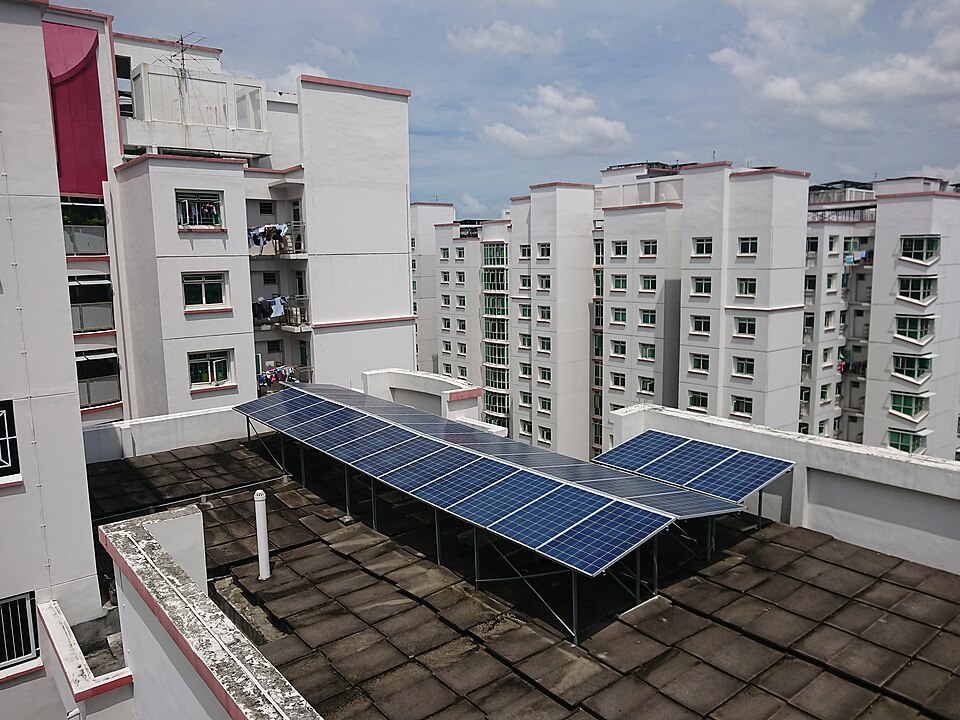
Corporate Net-Zero Plans: How to Check the Path from Promise to Delivery
Follow a corporate net-zero target from promises to projects. Use a worked example to check delivery milestones, funding and unexplained emissions reductions.
Read article →
Sponge Cities Explained: How Urban Green Spaces Reduce Flood Risk
Sponge cities make room for rain, but cannot make every storm harmless. Explore Singapore’s example, a simple storage calculation and the limits to check.
Read article →
Rice Methane Explained: Can Alternate Wetting and Drying Help?
How alternate wetting and drying can reduce rice methane, why nitrous oxide matters, and what reliable irrigation means for farmers in Southeast Asia.
Read article →