
Two things are true at the same time, and most coverage of climate progress picks one and discards the other.
The first is that clean energy technology has improved far faster and far more cheaply than almost any serious forecaster expected fifteen years ago. That is not a talking point. It is a measured, documented collapse in cost that has already reshaped how electricity gets built in most of the world.
The second is that global emissions have not fallen. Fossil carbon dioxide emissions reached an estimated 38.1 billion tonnes in 2025, a record, according to the Global Carbon Budget. Atmospheric CO2 reached 425.6 parts per million, 53 per cent above the pre-industrial level of roughly 278 ppm. Ocean heat content set a record. Global mean sea level set a record for the fourteenth consecutive year.
These two facts are not in tension. They describe different parts of the same system. One is about the cost of building clean supply. The other is about how fast total energy demand is growing and how little fossil generation is actually being retired. This page walks through both columns of the ledger.
What has genuinely changed: the cost collapse
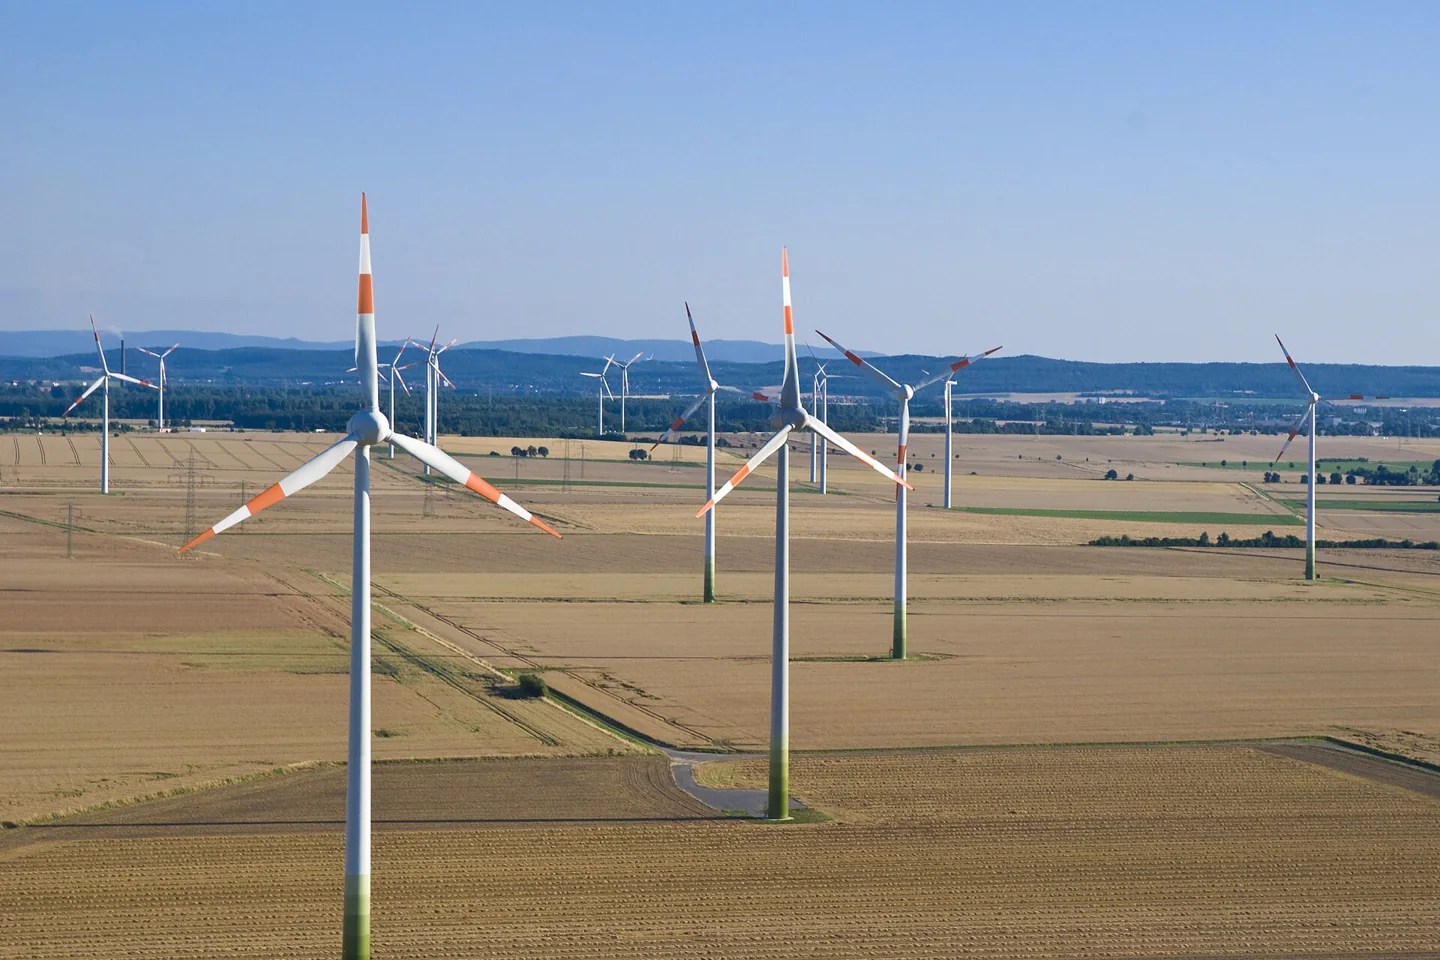

Between 2010 and 2024, the levelised cost of electricity from utility-scale solar fell by roughly 90 per cent. Onshore wind fell by roughly 70 per cent over the same period. Four-hour battery storage fell by around 90 per cent between 2012 and 2025. In 2025 alone, the global benchmark cost of a four-hour battery project fell 27 per cent year on year, to $78 per megawatt hour.
Most people have not updated on this. They are still carrying a mental model of renewables as expensive, subsidised and marginal — a model that was accurate in 2009 and is not accurate now.
It is important to be clear about why this happened, because the reason determines whether it continues. These were not lucky breakthroughs. They were learning curves: manufacturing costs fell in a predictable relationship to cumulative production volume, and that volume was created by deliberate policy. German feed-in tariffs, Chinese industrial policy and manufacturing scale, US tax credits, and competitive auctions across dozens of countries each bought down the cost of the next unit. Policy created demand, demand created scale, scale created cheapness. Countries that never subsidised solar still benefit from the price today.
The honest counterpoint is that the curve does not go down every single year. In 2025, benchmark costs edged up for several technologies. Fixed-axis utility-scale solar rose about 6 per cent to $39/MWh. Onshore wind reached $40/MWh. Offshore wind rose to roughly $100/MWh. These increases came from supply chain pressure, higher financing costs and grid connection constraints — not from any failure of the underlying technology. Forecasts still point downward over the longer term: roughly 30 per cent further reduction for solar by 2035, around 25 per cent for battery storage, 23 per cent for onshore wind and 20 per cent for offshore wind. But a page that only showed you the downward line would be selling you something.
What that made possible


Cheap technology changes what can be built, and the deployment numbers reflect it.
The world added a record 692 GW of renewable capacity in 2025 according to IRENA, of which about 511 GW was solar — roughly three-quarters of all additions. Total installed renewable capacity reached 5,149 GW, close to half of all installed power capacity worldwide. Asia accounted for around three-quarters of the new build.
More significant than the raw capacity figure is what solar has become when paired with storage. Around 87 GW of combined solar and storage was added in 2025, delivering power at an average of $57/MWh. That combination is the important development, because it turns a variable resource into something closer to dispatchable power — electricity available when the system needs it rather than only when the sun is up. That is the property fossil plants were valued for.
Coal demand has flattened. The International Energy Agency describes global coal demand as having reached a plateau, with a slight decline plausible by 2030, driven largely by China, which accounts for more than half of world coal use and saw demand fall marginally in 2025. Electric vehicles crossed a threshold that would have sounded implausible a decade ago: the IEA reports that electric cars reached about 25 per cent of global new car sales in 2025, with sales above 20 million vehicles.
What has not changed
None of the above has yet bent the emissions curve.
Energy production accounts for roughly two-thirds of global greenhouse gas emissions, so decarbonising energy is the central task. But added clean capacity is not the same thing as displaced fossil fuel. Global electricity demand has been growing fast enough that a large share of new clean generation has gone into serving that growth rather than replacing existing coal and gas plants. A coal plant that keeps running at a lower capacity factor still emits. A coal plant that is never built is a real gain, but it does not show up as a reduction in the emissions ledger.
The gap between what governments have pledged and what they have enacted also remains wide. The Climate Action Tracker’s 2025 assessment puts warming under currently implemented policies at about 2.6°C, and about 2.2°C when binding long-term and net-zero targets are included. Under the optimistic assumption that every announced target is met in full, the median estimate is around 1.9°C. The distance between 2.6 and 1.9 is the distance between policy and promise.
Measured temperature is consistent with that picture. The global mean temperature in 2025 was approximately 1.43°C above pre-industrial levels, among the three warmest years on record — and notably, that happened without an El Niño to amplify it.
The demand problem nobody planned for
Most transition modelling from a decade ago assumed electricity demand in wealthy economies would stay roughly flat. It has not.
Data centres are the visible driver. The IEA projects global data centre electricity consumption roughly doubling to around 945 TWh by 2030, just under 3 per cent of world electricity, growing at around 15 per cent a year — more than four times the growth rate of everything else. In advanced economies, data centres account for over 20 per cent of total demand growth to 2030.
The less discussed driver is cooling, and it carries a feedback that deserves stating plainly: a hotter climate raises electricity demand for air conditioning, which raises generation, which — where that generation is fossil-fuelled — raises emissions. Warming increases the demand for the energy that causes warming. This is not runaway physics, but it is a real and growing load that grid planners now have to build around.
The practical consequence is that clean supply is not competing against a fixed target. It is competing against a moving one.
What “1.5°C” actually means now
This is the most widely misreported number in climate coverage, so it is worth being precise.
A single calendar year at or above 1.5°C is not the same as breaching the Paris Agreement threshold. The Paris temperature goal refers to a long-term average — typically understood as a multi-decade mean, usually assessed over about twenty years — not to any individual year. Individual years fluctuate with El Niño, La Niña, volcanic activity and ocean cycles. A year at 1.5°C is a signal, not a verdict.
Having said that clearly, the honest follow-through is this: on the current trajectory, the long-term threshold is likely to be crossed. That is why “overshoot” has become the mainstream framing in the scientific literature. Overshoot means exceeding 1.5°C for a period and then bringing temperatures back down, which requires both reaching net zero and then removing carbon dioxide at scale. It is not a comfortable framing. It is simply the one that follows from the arithmetic.
Two things this does not mean. It does not mean 1.5°C is a cliff edge where impacts switch on. And it does not mean every fraction beyond it is equivalent — 1.6°C is meaningfully better than 1.8°C, which is meaningfully better than 2.2°C. Every tenth of a degree avoided is avoided permanently.
What is actually working
Concrete levers with measurable results:
Competitive auctions. Reverse auctions for renewable contracts have repeatedly produced lower prices than administratively set tariffs, and have done so across very different markets. This is a policy design that transfers well.
Satellite methane detection. UNEP’s International Methane Emissions Observatory operates the Methane Alert and Response System, which uses data from more than thirty satellite instruments to detect large methane plumes, attribute them to specific facilities and notify operators and governments. Since 2023 it has issued over 5,000 alerts across 33 countries. The honest caveat: only about 13 per cent of alerts receive any response. The detection problem is solved; the accountability problem is not.
Efficiency standards. Appliance and vehicle efficiency standards are unglamorous, cheap to administer and reliably deliver reductions, because they change the entire stock of new equipment rather than relying on individual choices.
Grid interconnection. Transmission is now a binding constraint in many markets. Interconnection between regions reduces the storage required to run a high-renewables system, because weather is not correlated across long distances.
Industrial electrification. Heat pumps for low and medium-temperature industrial heat, and electric arc furnaces for steel, move demand from combustion to a grid that is decarbonising on its own.
How to read progress claims
Three checks for a climate-progress claim
Look for an observed result, not only a future pledge.
Check the baseline, boundary, units and period.
Read assumptions, uncertainty and remaining emissions.
Four distinctions that will let you assess most climate progress claims yourself:
Capacity is not generation. A gigawatt of solar and a gigawatt of coal do not produce the same amount of electricity per year. Capacity figures describe what was built; generation figures describe what was delivered. Ask which one is being quoted.
Pledges are not policy. A 2050 net-zero target with no enacted mechanism is an intention. The Climate Action Tracker gap between 2.6°C and 1.9°C is precisely this distinction, quantified.
Intensity is not absolute. “Emissions per unit of output fell 30 per cent” is compatible with total emissions rising, if output grew faster. Only absolute reductions change the atmosphere.
Additional procurement is not an unbundled certificate. Buying renewable energy certificates unconnected to new build does not cause new clean generation to exist. Signing a long-term contract that finances a new project does. Both can be described as “100 per cent renewable”.
The technology problem has gone better than forecast. The deployment and emissions problem has gone roughly as badly as forecast. Holding both in view at once is not fence-sitting. It is the only position that matches the data.