
A discussion-based climate lesson for secondary learners and adult groups.
Learning goals
By the end of this 60-minute session, learners should be able to distinguish weather from climate, separate an observation from a projection, and design a simple action with a measurable outcome.
Materials
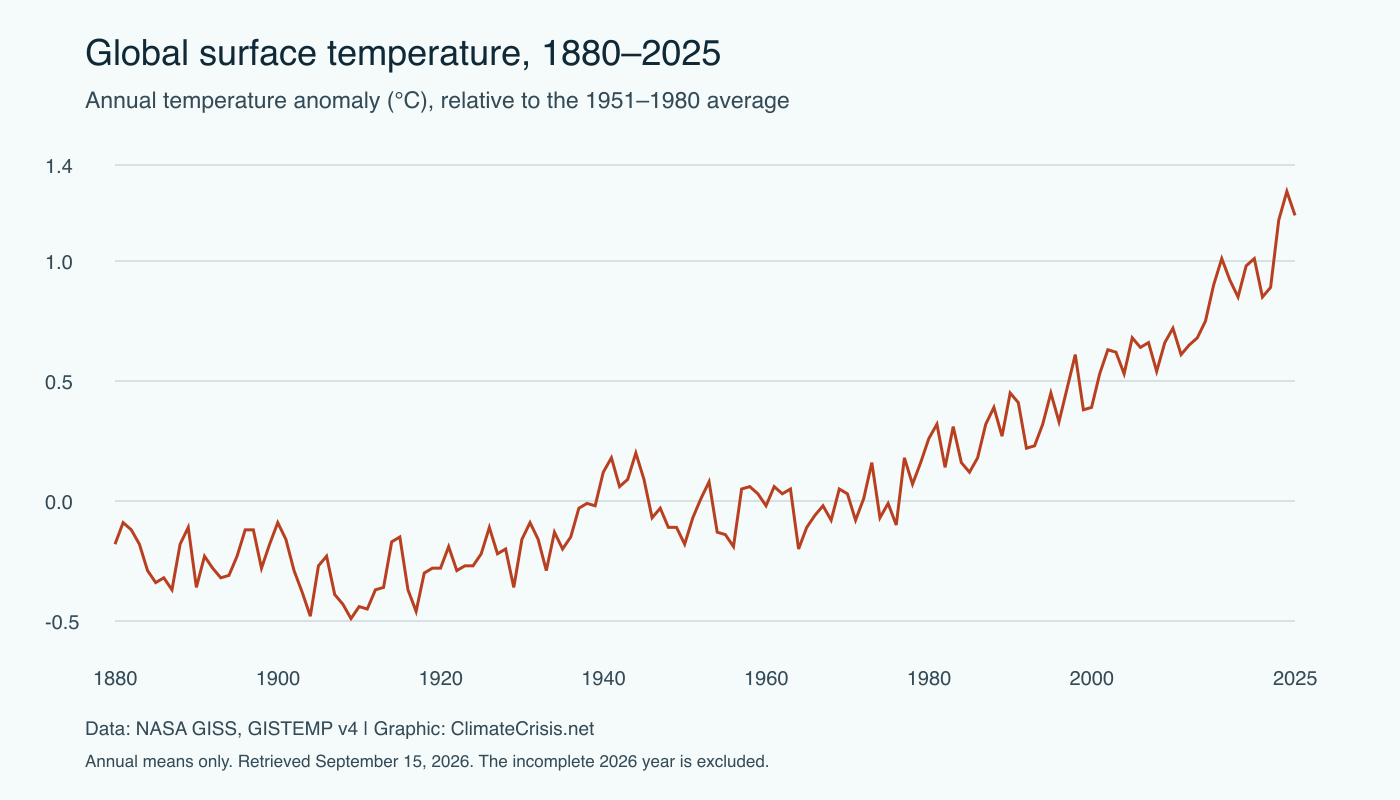
Provide paper, pens, a climate graph with its source and dates, and access to our evidence guide. A projector is optional. This page can be printed using the browser’s Print command.
Session plan
From a climate question to evidence
Choose a question and state what would count as evidence.
Identify graph axes, units, baseline and time period.
Separate observations from interpretations.
Explain one conclusion and one remaining uncertainty.
- 0–10 minutes — Start with questions. Ask learners what they know and what they want to check. Sort statements into observations, explanations and predictions.
- 10–25 minutes — Read a graph. Identify axes, units, timeframe and baseline. Describe the pattern before proposing a cause.
- 25–40 minutes — Evaluate a claim. Groups identify what evidence would support or challenge a climate statement. Discuss uncertainty and the difference between a local event and a global trend.
- 40–55 minutes — Plan an action. Choose a school or household activity, a baseline, a change and a review date. Consider cost and who has authority to make the change.
- 55–60 minutes — Exit ticket. Each learner writes one evidence-based conclusion and one unresolved question.
Assessment and adaptation
Assess the clarity of reasoning rather than agreement with a slogan. For younger learners, simplify the graph and use familiar local examples. For advanced groups, compare datasets or discuss alternative explanations.
Add a film discussion · Continue reading
Prepare an evidence card
Give each group a card with four prompts: what is the claim, what was measured, what period does it cover, and what remains uncertain? Ask learners to fill it in using the graph and its source. This makes their reasoning visible without requiring everyone to start with the same background knowledge.
Suggested assessment rubric
- Source awareness: identifies the creator, date and purpose of the evidence.
- Graph reading: describes axes, units and the reference period accurately.
- Reasoning: distinguishes a measured pattern from an explanation or future scenario.
- Action planning: proposes a feasible step with responsibility and a review method.
Give feedback on those features rather than rewarding a particular slogan. Learners should be able to revise a claim when the evidence does not support it.
Accessibility and extension
Provide the graph description in text and avoid relying on colour alone. Allow written, spoken or paired responses. If internet access is limited, prepare printed source extracts in advance with the publication date and URL.
For a second session, ask groups to compare two explanations of the same measurement. They can identify which details each includes, where the interpretations differ and what additional evidence would resolve a disagreement. This is an original discussion plan, not an accredited curriculum or a substitute for local teaching requirements.