
A building retrofit can be “designed to save 25%” and later show a different change on the electricity bill. That does not automatically mean the model failed or the project worked. Modelled and measured savings answer related but different questions.
A model estimates energy use under defined assumptions. Measurement records what happened under actual weather, occupancy, schedules and operations. Credible evaluation connects the two through a documented baseline and a measurement and verification plan.
What modelled savings mean
Simulation tools represent the building envelope, lighting, cooling, controls and operating schedules. They can compare a proposed design with a reference building or estimate the effect of a retrofit before money is spent.
Models are essential for design decisions, but results depend on inputs. If occupancy hours, thermostat settings or equipment loads differ from reality, actual consumption will differ too.
What measured savings mean
Metered savings are not simply “last year’s bill minus this year’s bill.” Weather, floor area, occupancy and production may have changed. Analysts usually create an adjusted baseline: an estimate of what the building would have used after the retrofit if the efficiency work had not occurred.
The U.S. Department of Energy describes four common measurement and verification approaches. They range from measuring selected parameters for an isolated retrofit to whole-building meter analysis and calibrated simulation.
Four verification approaches
- Option A: measure key parameters and stipulate others.
- Option B: measure the relevant parameters of the system or retrofit.
- Option C: analyse whole-building utility data, usually adjusting for weather and other variables.
- Option D: use a calibrated simulation when direct measurement or a clean baseline is difficult.
The best option depends on the measure, expected savings, data availability and the cost of verification. A simple lighting change does not always need the same monitoring as a complex cooling-plant upgrade.
Why the performance gap appears
- Operating hours are longer than assumed.
- Set points or controls differ from the design.
- Equipment was installed but not commissioned correctly.
- Occupancy or plug loads increased.
- Weather was hotter or more humid.
- Maintenance degraded performance.
- The original model used optimistic efficiencies.
In Southeast Asian commercial buildings, cooling and humidity control can dominate electricity use. A high-efficiency chiller will not deliver expected savings if controls, pumps, cooling towers or air distribution operate poorly.
A simple baseline example
Suppose a building used 1,000 MWh before a retrofit and 900 MWh after it. The raw reduction is 100 MWh. If the post-retrofit year was cooler and the adjusted baseline is 960 MWh, verified savings are 60 MWh. If occupancy increased and the adjusted baseline is 1,050 MWh, savings could be 150 MWh. The adjustment method determines whether the comparison is fair.
What a credible savings claim includes
- The baseline period and any exclusions.
- The measurement boundary: equipment, system or whole building.
- Weather, occupancy and production adjustments.
- Meter accuracy and missing-data treatment.
- Commissioning and maintenance evidence.
- Uncertainty and the verification period.
Efficiency is a performance outcome, not only an equipment label. Modelled savings support design; measured savings test operation. The strongest projects plan for both before installation and keep verifying performance after the first year.
Measurement also matters for flexible operation: compare this with our analysis of shifting electricity demand in Thailand and the guide to electricity emissions factors.
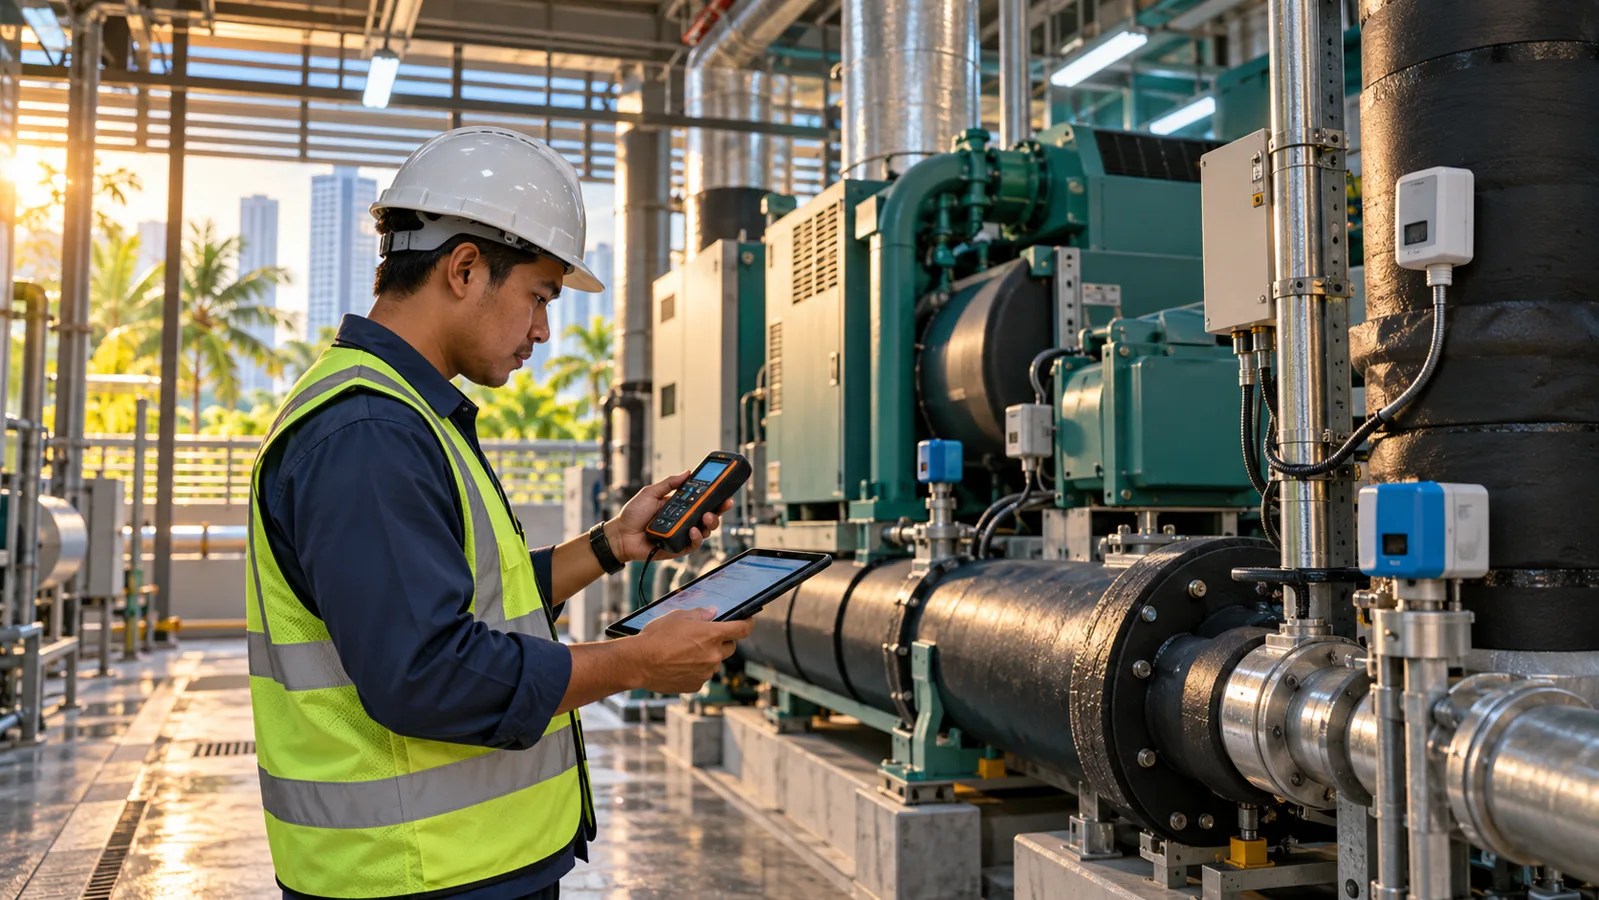
Featured image: AI-generated editorial illustration by ClimateCrisis Editorial. It does not depict a specific place, project or event.