
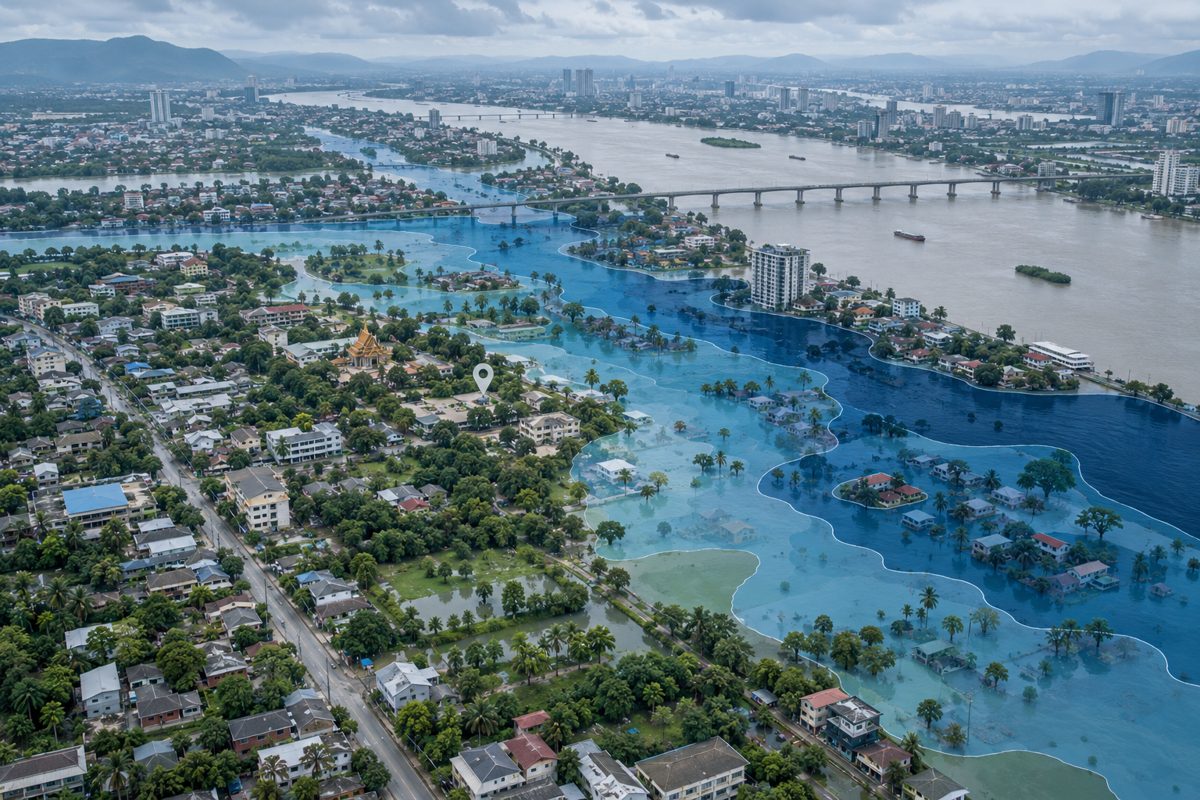
A coloured flood map can look precise, but its meaning depends on the question the map was built to answer. Some maps show where water may reach in a modelled event. Others combine the hazard with people, buildings or roads that could be affected. A live incident map may show what is happening now. These products should not be treated as interchangeable.
This guide explains how to read probability, depth, exposure, vulnerability and residual risk before using a flood map to make a decision. It is an evergreen explainer, not a warning about a current flood. Always follow local authorities for active alerts and seek a site-specific assessment for building, insurance or evacuation decisions.
First ask what the map actually shows
A flood hazard map usually describes the possible physical event: where water could extend and, when the data are available, its depth, velocity or duration. A flood risk assessment goes further by considering what lies in the affected area and how susceptible it is to damage.
A 2025 World Bank flood-risk modelling guide separates risk into three components: hazard, exposure and vulnerability. Exposure can include people, land, buildings and infrastructure. Vulnerability describes how susceptible those exposed elements are to loss or damage.
This distinction matters. A deep flood in an unoccupied floodplain is a serious hazard, but the direct consequences differ from the same depth around homes, a hospital or an electricity substation. Conversely, two neighbourhoods inside the same hazard zone may face different risks because their buildings, access routes and residents have different vulnerabilities.
A “100-year flood” does not wait 100 years
Many flood maps use a return period. A 100-year return period corresponds to a 1% annual exceedance probability: a 1 in 100 chance of that threshold being reached or exceeded in any given year. It does not mean the event can happen only once every 100 years, and two such events can occur close together.
A simple calculation shows why the wording matters. If the annual probability stayed at 1% and each year were treated as independent, the probability of avoiding the threshold for 30 years would be 0.9930, or about 74%. The probability of experiencing it at least once would therefore be:
1 − 0.9930 ≈ 26%
This is an illustrative probability calculation, not a forecast for a particular property. Real flood probability can change as rainfall, sea level, land use, drainage and flood defences change. Check the map’s date and whether its model includes a future climate scenario.
Read extent, depth, velocity and duration separately
A coloured outline may show only the possible flood extent. It does not automatically tell you how deep or fast the water could be. If the legend provides more variables, read each one separately:
- Extent: the area that the model shows as inundated.
- Depth: the modelled water level above the ground at a location.
- Velocity: how quickly water may move, which can change the danger to people and structures.
- Duration: how long flooding may remain, affecting access, sanitation and recovery.
Also identify the source of flooding. River flooding, intense rainfall that overwhelms drainage, coastal flooding and reservoir failure involve different processes. A map covering one source is not proof that the others are absent.
Thailand’s live and historical layers answer different questions
Thailand’s Department of Disaster Prevention and Mitigation information system provides current disaster reports and operational map layers. Its GIS includes water-level and reservoir information, historical flood-affected areas and repeated-flood-risk layers.
These views are useful for different tasks. A current incident layer helps readers understand reported conditions. A historical layer shows where flooding was observed in selected past years. A probabilistic hazard map estimates the chance or intensity of possible events under stated assumptions. Before comparing colours across maps, check the legend, time period, source data and model purpose.
Historical occurrence can inform risk screening, but absence from a short historical record does not prove safety. Likewise, being inside a modelled hazard area does not mean the same depth will occur in every flood.
Flood protection reduces risk but does not erase it
The UN Office for Disaster Risk Reduction defines residual risk as the disaster risk that remains even when effective risk-reduction measures are in place. Flood walls, pumps, drains and retention areas can lower the probability or consequences, but they can be overtopped, blocked, exceeded or fail.
For example, UK planning guidance lists overtopping, a breach of a raised defence, blockage of a drainage route and pump failure as forms of residual flood risk. The policy thresholds in that guidance are specific to England, but the underlying reading lesson is widely applicable: find out whether the map assumes defences are present and functioning.
Measures such as parks, detention areas and permeable surfaces can reduce runoff in some conditions. Our sponge-city explainer describes both their benefits and limits. No single intervention removes the need to plan for events that exceed its design capacity.
Use a six-question flood-map checklist
- What is mapped? Hazard, exposed assets, estimated damage, a live incident or a historical footprint?
- Which flood source is included? River, rainfall, coast, reservoir or a combination?
- What probability or scenario is shown? Read the annual probability as well as the return-period label.
- Which variables are available? Extent alone, or also depth, velocity and duration?
- What assumptions and date apply? Look for model resolution, input data, climate scenario and update date.
- What risk remains? Check the treatment of defences, drainage, access routes and failure scenarios.
Use the map as a screening tool rather than a property-level guarantee. Pair it with local observations, official warnings and professional advice appropriate to the decision. The same discipline applies when reading water-supply indicators: our drought guide explains why one indicator rarely describes the whole system.
A good flood map makes its assumptions visible. A careful reader makes those assumptions part of the conclusion.